My professional career has been closely tied to the housing market since its beginning. I was “pulled” into residential real estate by my father who saw it as a great opportunity for me to make a good income while I worked on my Bachelor’s degree. It was during those early days that I began to notice discrepancies between what the market needs versus what the market offers. I was bothered by this because my intuition recognized there was more need and desire for housing than what the market was delivering.
While I was working on my Master’s degree I began to understand why there was a gap. Zoning was a prohibiting factor. Zoning had become hyper-focused on regulating use and was now written in a way that created a market caste system that primarily favored single family detached homes, townhomes, and stacked flats (condos and apartments). Anything else was off the table – regardless of whether the need or desire for other historical housing types was warranted.
I am now at a point in my career where my mind is constantly recognizing analytics that seem to identify trends associated with problems in the housing market. I recently went down a rabbit hole of information that focused on trends within coupling rates and total fertility rates. These data sets, in isolation, may not seem to be directly connected to housing – but they are. Both sets of statistical data have a bearing on household creation that then extrapolate into the associative wants/needs tied to housing.
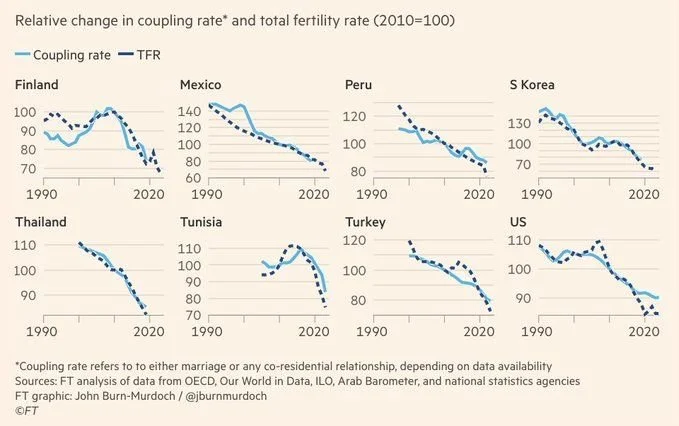
This all started when I came across the set of graphs shown below which demonstrates the heavy decline in coupling and total fertility rates around the world:
Coupling and Total Fertility Rates (1990 - 2020)
For clarification, a coupling rate refers to the rate at which individuals form romantic partnerships or marriages within a given population. It is a measure of how frequently people are entering into committed relationships, such as marriages or long-term partnerships, over a specific period of time. In demographic studies, the coupling rate is often analyzed alongside other metrics like birth rates and divorce rates to understand broader social trends and their implications for population growth and family structures.
It's important to understand these trends. It's also important to grasp that Utah is not immune to these trends. Utah's coupling rate follows world trends (just not as significantly) with the rate of marriage dropping (never-married women rising from 22.0% in 1980 to 28.3% in 2021) while divorce rates in Utah have decreased since the 1970s as shown below:
1970: ~4.3 per 1,000 population.
1980: ~5.0–5.3 per 1,000 (peak).
1990: ~4.7 per 1,000.
2000: ~4.1 per 1,000.
2010: ~3.7–3.9 per 1,000; 10.1% of ever-married women divorced.
2018: ~3.3 per 1,000; 9.8% of ever-married women divorced.
2023: ~3.0–3.2 per 1,000.
While these statistics give the appearance that the rate of divorce is dropping these numbers only account for when marriage occurs (since a divorce can only be counted if a marriage takes place first). People still get together, combine into households – without marriage, and split up. This would suggest that if break ups could be accounted for, the dissolution of relationships would be significantly higher than just a measurement of divorces.
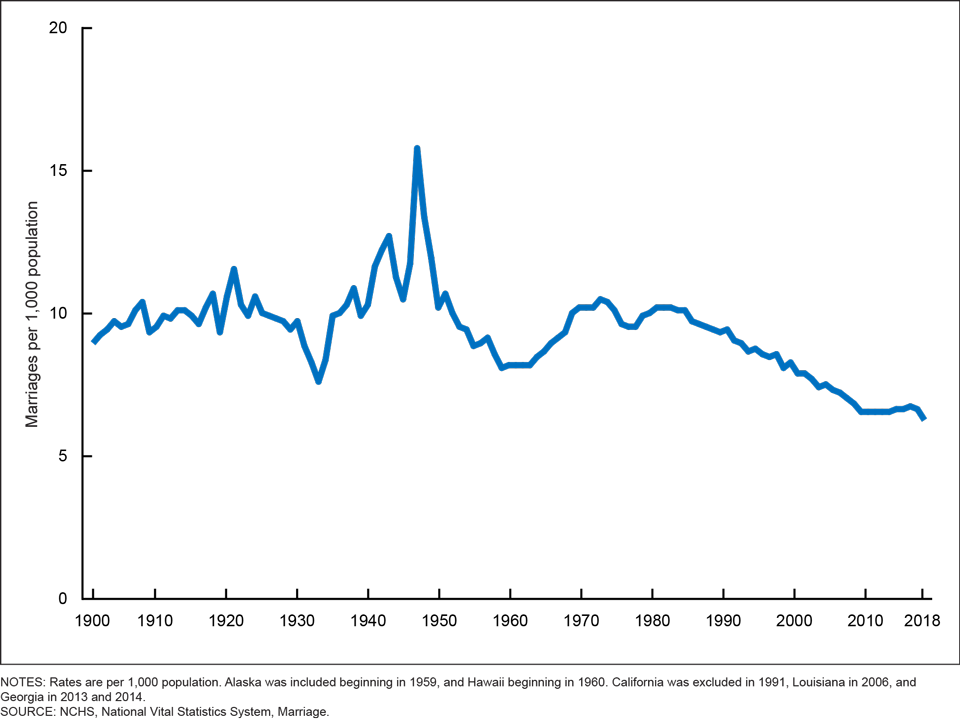
Also important to note is the falling number of marriages nationally. According to the National Center for Health Statistics adults in the United States are “increasingly postponing marriage” and “a record number of current youth and young adults are projected to forego marriage altogether.” As marriage continues to evolve as being more transactional in nature and/or unnecessary to a life fulfilled both the number of marriages and number of divorces will fall.
Marriage Rates: United States (1900 - 2018)
The total fertility rate (TFR) is a demographic measure that estimates the average number of children a woman would have over her lifetime, assuming she experiences the current age-specific fertility rates throughout her reproductive years (typically ages 15-49). It is a useful indicator for understanding population growth and demographic trends.
The TFR is calculated by summing the age-specific fertility rates for all age groups in a given year. A TFR of about 2.1 children per woman is considered the replacement level, meaning it is the rate at which a population exactly replaces itself from one generation to the next, without migration.
Utah's total fertility rate has reduced every decade as follows (keep in mind replacement level - which is the balancing of births to deaths and keeping population numbers stable long term - is recognized as 2.1):
1970: 4.30
1980: 3.50
1990: 3.00
2005: 2.45
2014: 2.33
2016: 2.15
2018: 1.99
2021: 1.92
2022: 1.85
2023: 1.80
You may be asking yourself why I went down this rabbit hole in the first place. There are a few key reasons for it:
I have found there is a common misnomer among Utah residents in thinking that “we are different” and that Utah’s trends buck the system of what happens nationally. Hopefully you can see from what I have shown that this is a fallacy. Utah may be delayed in its path to following national trends, but Utah eventually falls in line – for better or worse.
Reading between the lines when looking at the coupling rate and total fertility rate is a recognition that household types are changing. Within society as a whole household types are becoming incredibly diverse. There are young and mature singles, blended and multi-generational families, young and mature couples, and single parents of young and older children that are all outside of what used to be viewed as the traditional norm of a married couple with children. In fact, according to U.S. Census data married couples with children are now a statistical minority. “By 2022, married-couple households with children under 18 made up approximately 18% of all households, a decline of about 23 percentage points.”
With these shifts in household types comes the need to provide housing types that address the needs that go with these ever-diversifying household types. Wants and needs are different, but they aren’t being addressed in what the market is delivering. The impact of this leads to buying homes that are a compromise and often stretch household budgets to pay for that compromise because what the market has available doesn’t match what is needed.
When combining these trends with what can be learned regarding the household type / housing type relationship there are several key takeaways to be pointed out and learned from:
Household types come in many different forms. Some of those forms are recognized as being more traditional in nature while others may be in non-traditional forms. As adults age the form that their household takes will change over time, and in those changes will be different wants and needs associated with their housing.
Housing opportunities should be provided for all potential stages of a person’s life cycle. Whether those life cycle stages are traditional or non-traditional there should be housing alternatives that are inclusive to any and all conditions. The diversity of needed housing should occur by price, size and type.
With every household being created through either non-marriage or dissolution of marriage comes a household type which demands housing types and lifestyle needs which don't necessarily match the predominant housing type of single-family detached homes which have historically been meant for traditional families.
With the needs that come from non-traditional household types come the necessity for understanding how to deliver missing-middle housing. With missing-middle housing comes an understanding that its delivery should come inclusively with other housing types – not in isolation of a singular housing type. Housing variety should be experienced within the same neighborhoods and on the same streets. The tighter the knit the better.
Communities fare best when there are no gaps in their population. To minimize gaps in the population an abundance of housing types is imperative.
With every divorce comes a doubling in household creation. This means a household is typically going from a traditional family household type (married with kids) to two non-traditional household types. With a change in the TYPE of households comes a change in the TYPE of housing needed with the doubling of the households.
Daybreak | South Jordan, Utah
These statistics have clear impacts on not just the AMOUNT of housing that is needed, but also the TYPES of housing that need to be built. These trends are disturbing on the one hand but provide tremendous opportunity on the other. What we need to be cognizant of is the NUMBER of households being created by all these different trends and the TYPE of households being created. The development and homebuilding community needs to learn how to become well equipped to take advantage of all this. If this can happen both business and consumer interests can win. Let’s look past status quo thinking and behavior and make all this a reality.


